Contact the editor at karina@plainlanguagemedia.com As the 2010s wrap up, The Licensing Letter is taking the chance to review the last ten years. In terms of licensed retail sales, the story of the last decade is one of recovery from the impact of the Great Recession of 2007–2009, which directly resulted in a -11.5% decline in licensed retail sales in 2009 in the U.S. and … [Read more...] about A Decade in Review: Hindsight is 20/20
Product Categories
Share of Retail Sales of Licensed Merchandise, by Product Category, U.S.
Share of Retail Sales of Licensed Merchandise, by Product Category, Canada
Retail Sales of Licensed Merchandise, by Product Category, Canada
Share of Retail Sales of Licensed Merchandise, by Product Category, U.S. & Canada
Cosmetics, Toys & Electronics Drive Increases in Industry-wide Royalties in 2018
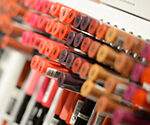
Contact the editor at karina@plainlanguagemedia.com. Roughly two-thirds of the product categories TLL tracks saw nominal bumps in industry-wide royalties in 2018, according to TLL's latest Licensing Business Survey. Make sure to review our breakdown of royalties by property type as well. The most common driver behind such growth was the increase in royalties by … [Read more...] about Cosmetics, Toys & Electronics Drive Increases in Industry-wide Royalties in 2018
Soft Goods, Home Lead Domestic Corporate TM/Brand Licensed Sales in 2017

By: Karina Masolova, karina@plainlanguagemedia.com Licensed retail sales of corporate trademark/brand merchandise grew 2.5% to reach $29.2 billion in 2017, according to TLL's Annual Licensing Business Survey. The biggest drivers behind the roughly $710 million increase in sales were soft goods like apparel and accessories; home-related goods like domestics, furniture, and … [Read more...] about Soft Goods, Home Lead Domestic Corporate TM/Brand Licensed Sales in 2017
What’s the Deal? Apparel, Home & Accessories Lead TLL’s Deal Sheet Count
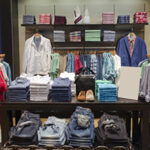
By: Karina Masolova. Contact the Editor at karina@plainlanguagemedia.com. TLL broke down the numbers behind the Deal Sheet to discover the driving trends behind licensing deals this year, as of August 2018. The most popular product category for deals struck this year was apparel, making up 18.3% of the total share with 428 deals. The home & home furnishings category was … [Read more...] about What’s the Deal? Apparel, Home & Accessories Lead TLL’s Deal Sheet Count
Licensed Entertainment/Character Sales Hit $31.1 Billion Worldwide; Soft Goods Lead Growth

By Karina Masolova, karina@plainlanguagemedia.com. Entertainment/character-based licensed goods continue to grow at a faster rate than any of the other five major property types TLL tracks globally—as well as the 13 major properties we track within the U.S./Canada territory. In the U.S./Canada, entertainment/character-based licensing grew by $435 million in 2017 to reach $13.2 … [Read more...] about Licensed Entertainment/Character Sales Hit $31.1 Billion Worldwide; Soft Goods Lead Growth
Warner Bros. Fetes Magical Potter Merch
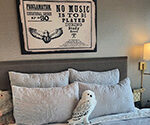
By Heather Perry; contact the Editor at karina@plainlanguagemedia.com. TLL was recently invited to Warner Bros.’ showcase for its Harry Potter, Fantastic Beasts, and Wizarding World brands with merchandise from over 30 licensees. In 2011, Warner Bros. reported that the Harry Potter franchise had generated $7 billion in retail sales for merchandise such as wands, hats, … [Read more...] about Warner Bros. Fetes Magical Potter Merch